Tech Insights
From Scan to Playable Game: Gaussian Splatting in Unreal Engine
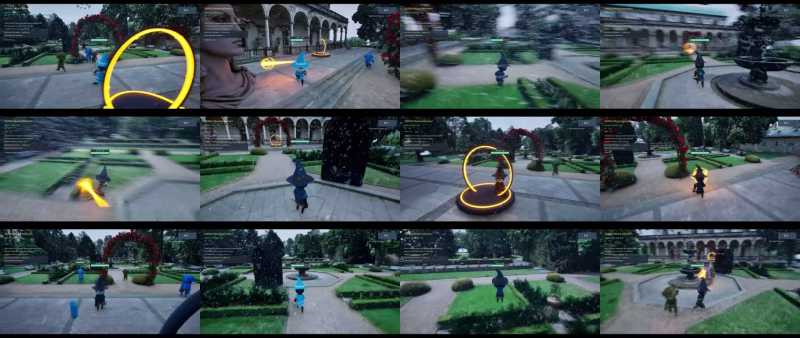
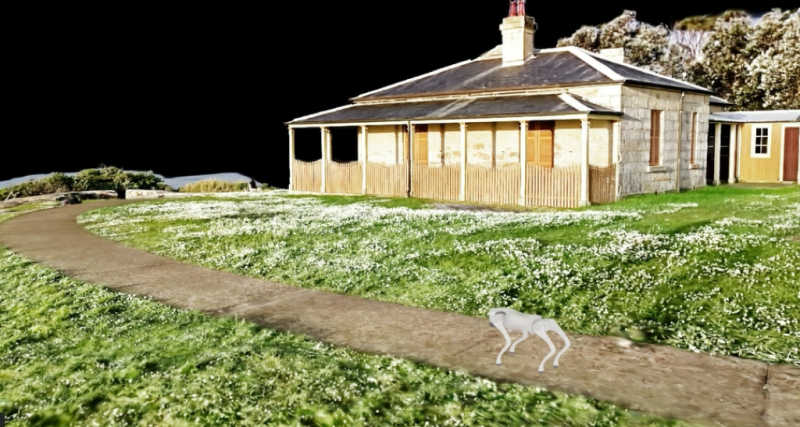
A garden scan became a playable Unreal Engine game in under two hours, with 3D Gaussian splatting for the level and an AI agent for the game logic.
Lixel L3 achieves ≤5 mm accuracy at 1σ across 1,524 point pairs. See the five-step validation workflow and Leica TS60 benchmark test data.
We have just launched the flagship high-accuracy scanner Lixel L3, with a specified accuracy of 5 mm @ 1σ (typical). Our confidence in this millimeter-level accuracy is backed by a rigorous, reproducible testing and validation methodology.
Validating the point cloud accuracy of Lixel L3 comes down to three questions: What was measured? How were the results calculated? And under what conditions do the results apply? This test first established the sample scope, reference system, and statistical methodology, then reported a 4.2 mm result, giving professionals in surveying, point cloud processing, and 3D reconstruction a clear basis for understanding the scope of the result.
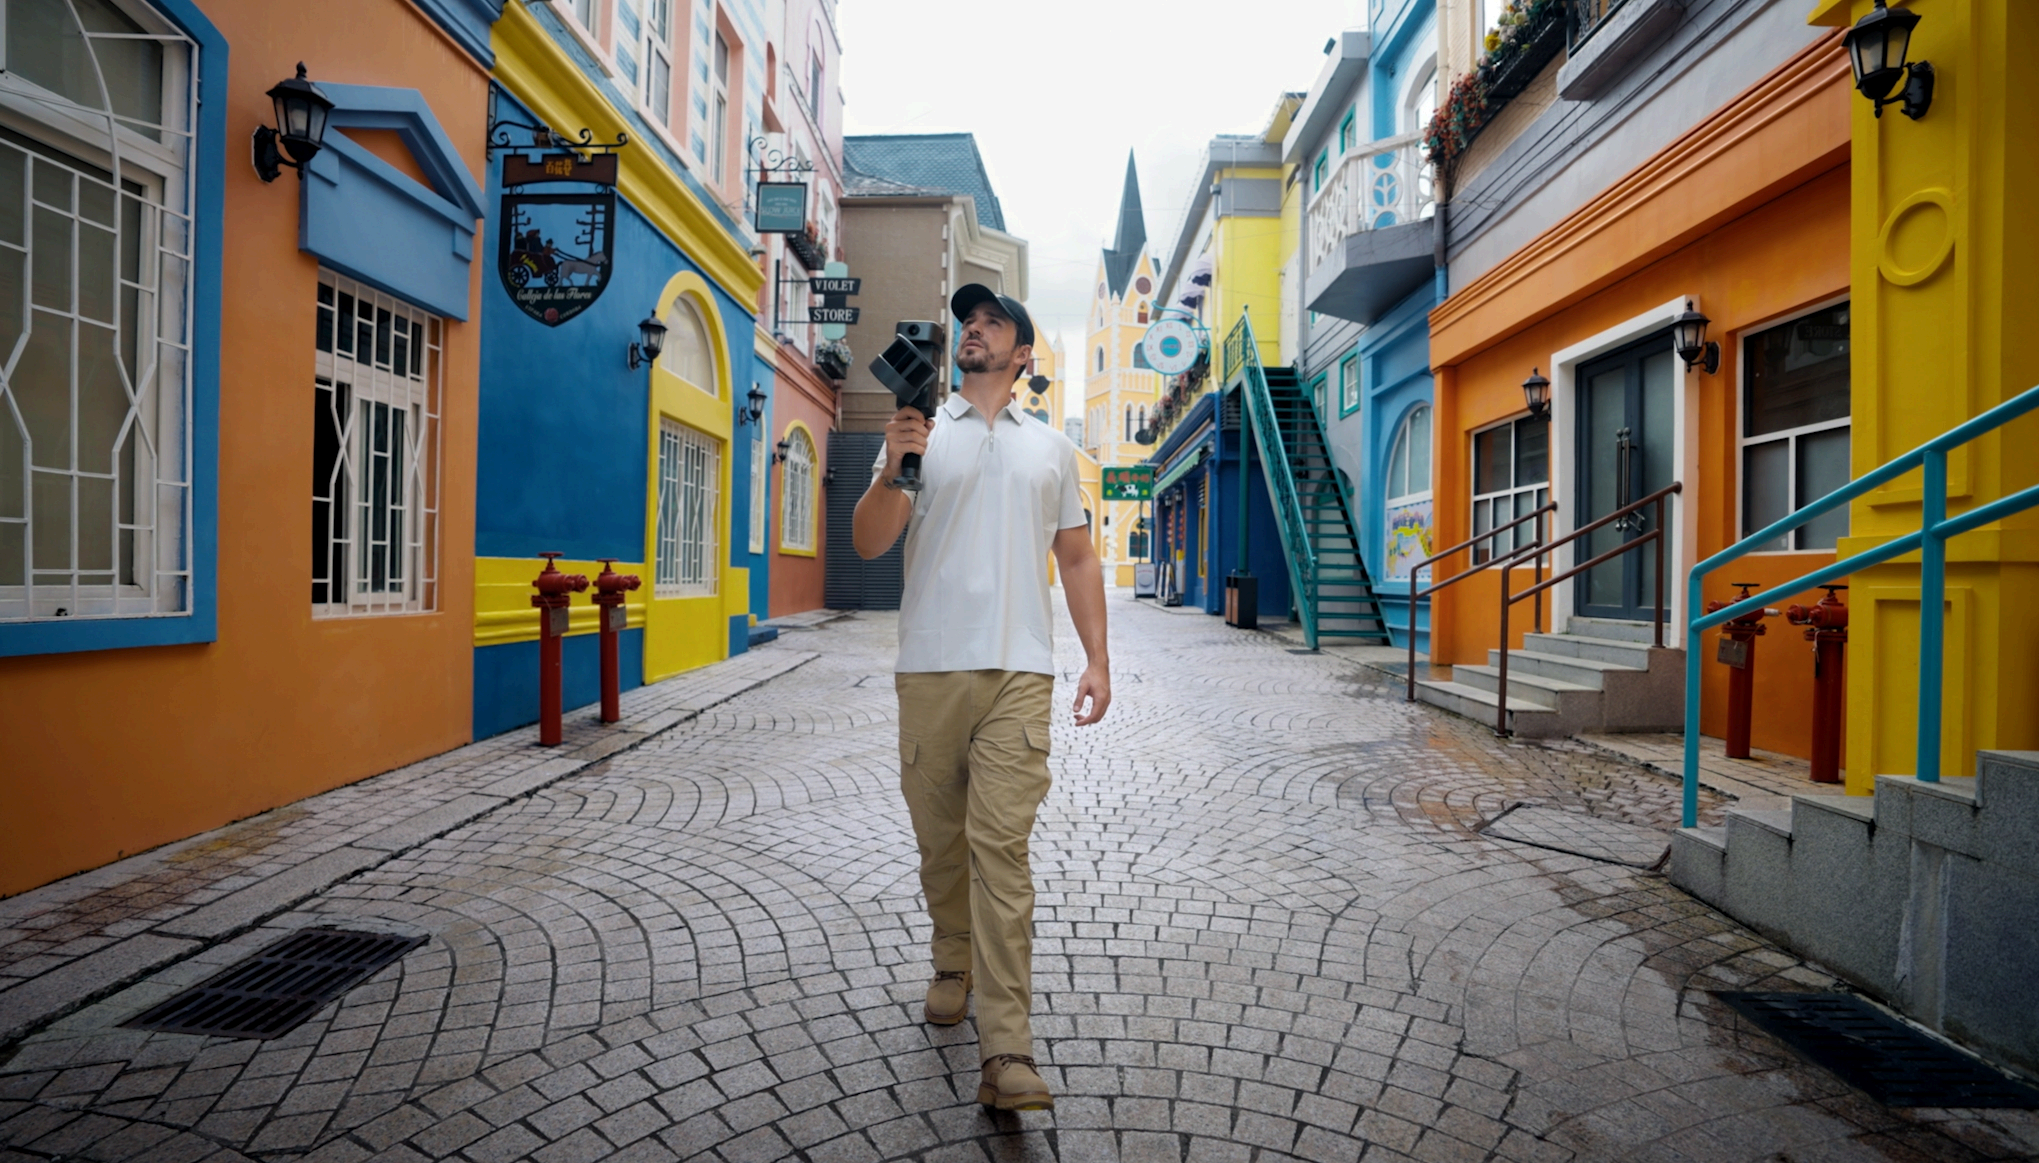
Lixel L3
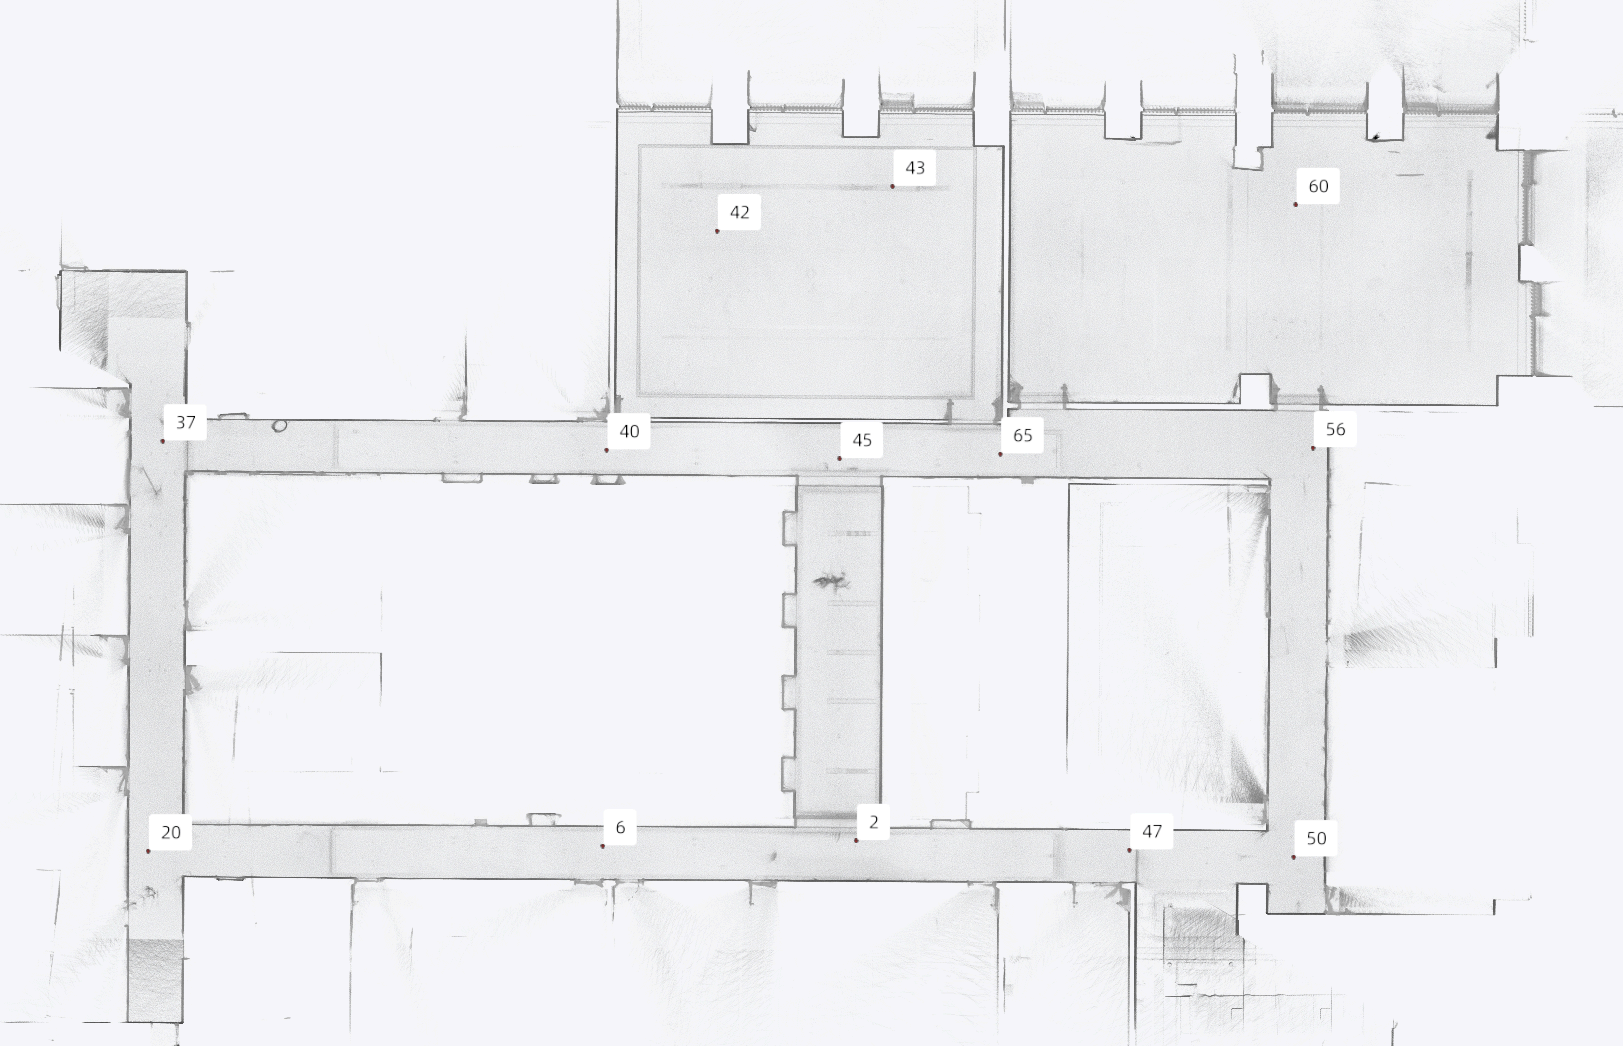
The test used 7 Lixel L3 units, covering both the 16-line and 32-line configurations, to complete 20 independent scan sets across an approximately 507 m² composite indoor test site. Thirteen targets were placed throughout the site to establish distance comparisons between the scan results and the reference system. These parameters define the sample base of the test, and the results should be interpreted within the corresponding test conditions.
| 7 units | 16/32 lines | Approx. 507 m² |
| 20 scan sets | 13 targets | Lixel L3 Top view of the test site point cloud and target distribution |
The reference system was established using a Leica TS60 total station, with a post-adjustment accuracy of 1.5 mm. This figure describes the post-adjustment accuracy of the reference system; it is not the measured accuracy of Lixel L3. Lixel L3 scan data was processed without GCP optimization and evaluated using a relative accuracy validation method.
A reference system was established using the Leica TS60, with a post-adjustment accuracy of 1.5 mm. This figure does not represent the measured accuracy of Lixel L3.
Five test operators used seven Lixel L3 units to perform multiple independent scans, producing a total of 20 point cloud datasets.
The center coordinates of the targets were automatically identified and calculated from each point cloud dataset.
Distances between target centers in the point cloud were calculated and compared individually with the corresponding reference distances measured by the total station, producing a distance deviation for each point pair.
The absolute values of the differences were taken, and all point-pair distance deviations from all devices and scan sets were pooled into a single dataset before calculating the overall percentiles.
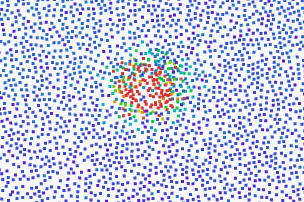
Raw point extraction information from the point cloud
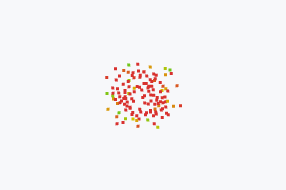
Target extraction results
Across the 20 scan sets, the test produced 1,524 point-pair distance comparison records, covering distances from 5.40 to 44.22 m, with a median of 20.23 m. More than 50% of the point pairs were over 20 m apart, covering the typical working distance range of handheld scanners.
All point-pair deviations from all devices and scan sets were pooled into a single dataset, then percentiles were calculated directly from the combined dataset. In other words:
20 scan sets → 1,524 point-pair distance comparison records → pooled and sorted → value at the 68th percentile
This pooled percentile methodology is consistent with comparable industry accuracy reports and provides a straightforward basis for interpretation.
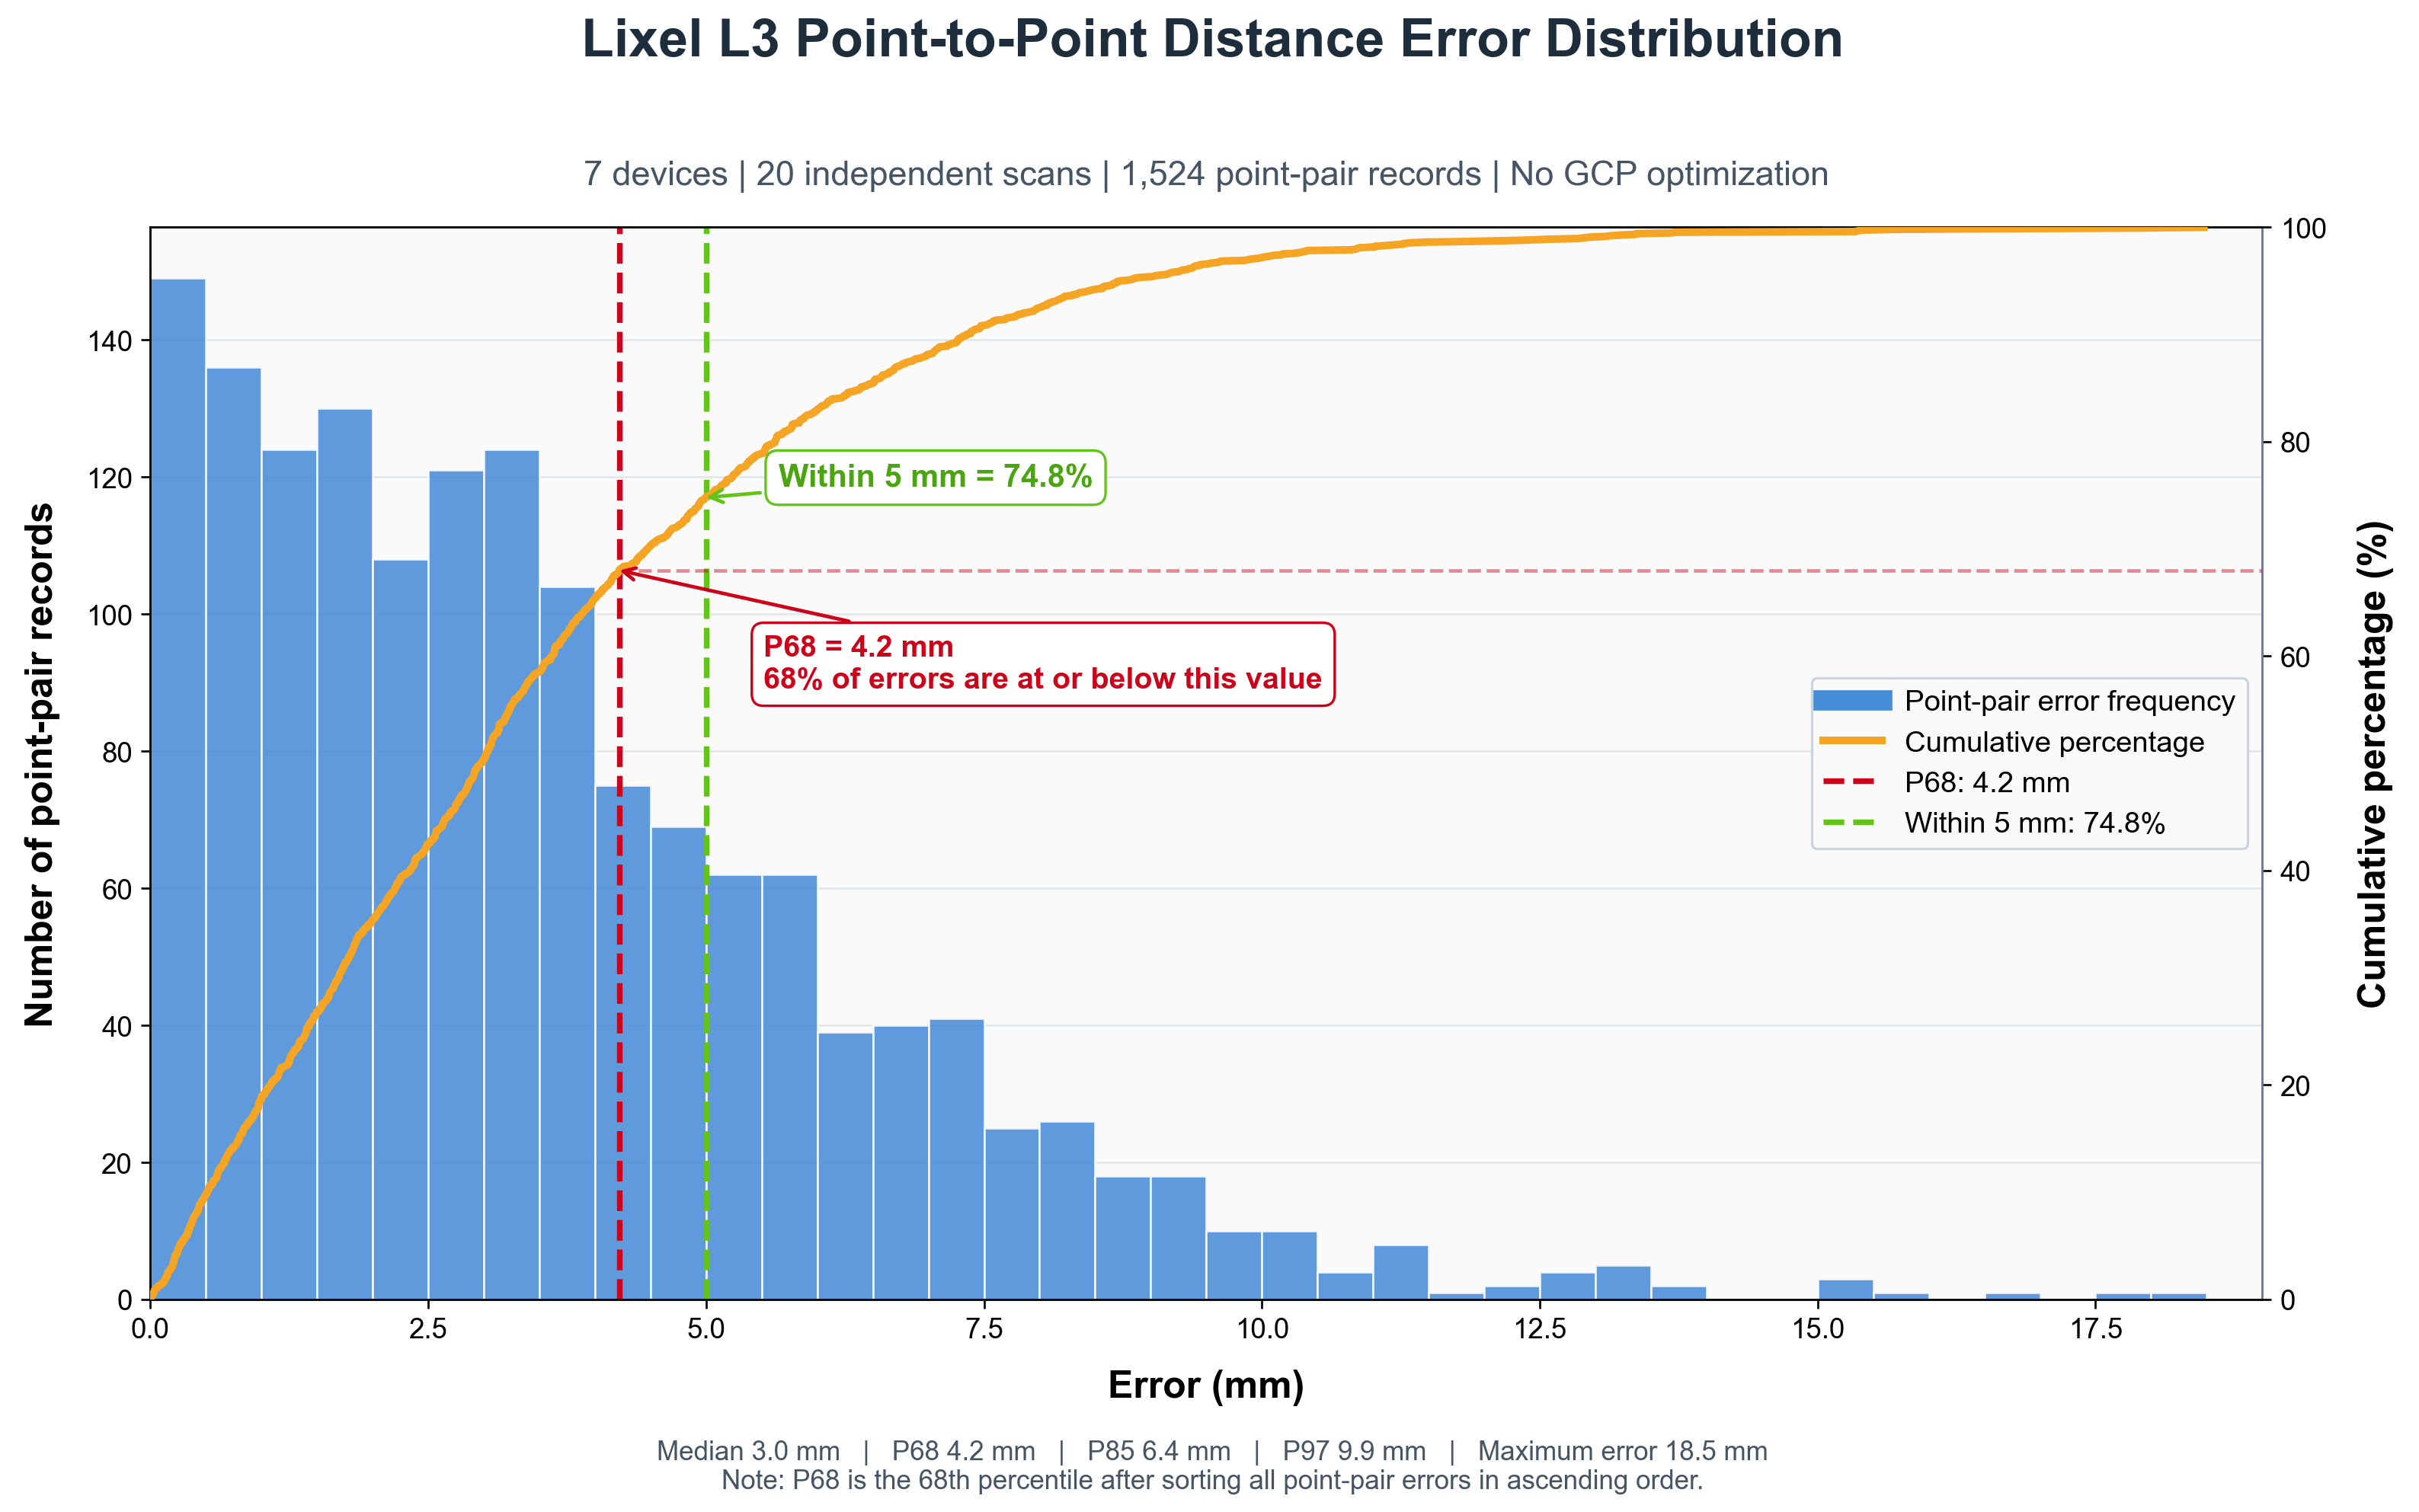
Lixel L3 point-pair distance deviation distribution
The relationship between P68 and 1σ has a specific statistical condition: P68 is approximately equivalent to 1σ only when the signed error distribution is approximately normally distributed with a zero mean, while P68 is calculated as the percentile of absolute errors.
The specified accuracy of ≤5 mm @ 1σ represents expected performance under typical working conditions. Actual accuracy can be affected by factors including site geometry, scan path planning, and environmental conditions, and deviations may vary somewhat in individually demanding scenarios.
Accuracy isn't something you simply claim. It's something you validate.
A garden scan became a playable Unreal Engine game in under two hours, with 3D Gaussian splatting for the level and an AI agent for the game logic.
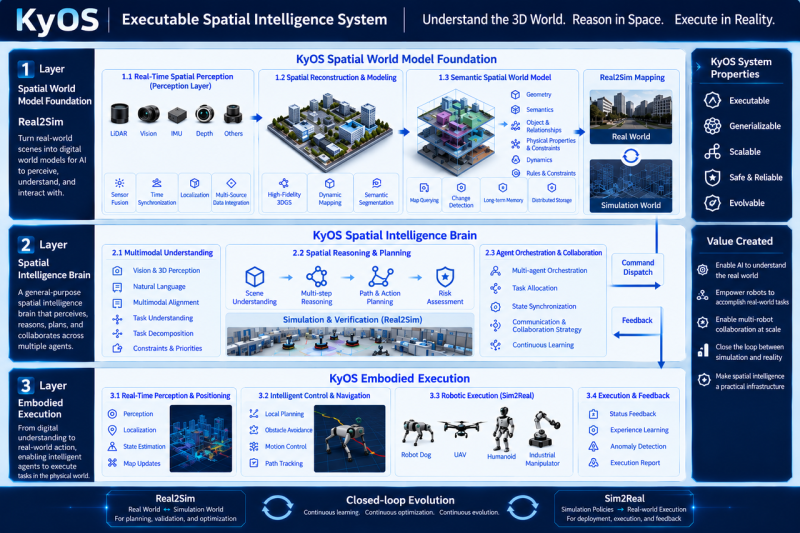
Scaling embodied AI requires KyOS, a closed-loop architecture coordinating perception, task planning, and reflex control across different timescales.
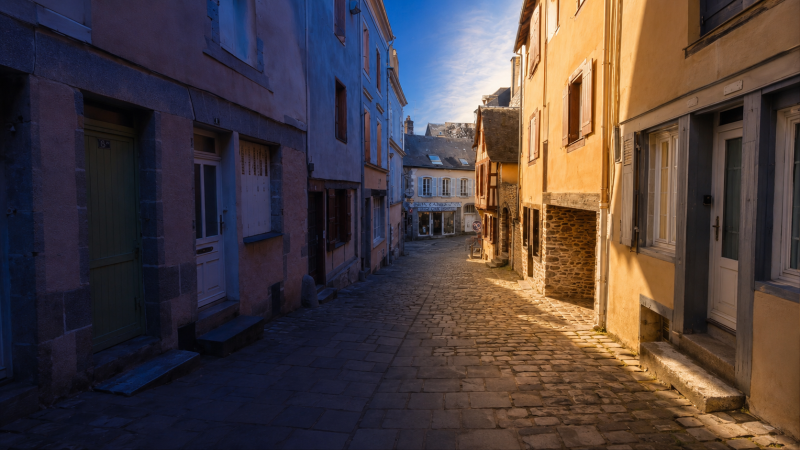
Turn static 3DGS captures into dynamic lighting variations using AI relighting tools to test sunsets, night looks, and mood changes in minutes.
From Real-World Capture to Interactive Simulation